

A new study by Franklin Associates research for the American Chemistry Council builds on and reaffirms a 2014 study that replacing plastics packaging with other substitutes would have severe adverse environmental impact.
The American Chemistry Council, one of the world’s most authoritative and respected industry associations, has released a new study that reaffirms that trying to replace plastics packaging with substitute materials is fraught with severe adverse impacts on the environment due to significant increases in material usage, energy used, water consumption, solid waste, greenhouse gas emissions, ozone depletion, acidification, eutrophication1 and global warming potential.
In research commissioned by the American Chemistry Council and carried out by Franklin Associates, the new study builds on an earlier study carried out in 2014 by the same agency and uses established data on the energy and GHG benefits of plastics compared to alternatives. According to Steve Russell, vice president of plastics, American Chemistry Council. “It expands our understanding of critical environmental benefits beyond energy and highlights key environmental indicators like water use and waste generation.” The report summarizes that looking at the United States data alone, when compared to alternatives, production, use and disposal of plastic packaging across the six major packaging segments studied per year saves:
– enough energy to fuel 18 million passenger vehicles;
– enough water to fill 461,000 Olympic swimming pools;
– waste equivalent to the weight of 290,000 Boeing 747 airplanes; and,
– the acidification potential of 292,000 railcars of coal.
“The findings challenge common misperceptions around plastics and underscore that plastic is a versatile efficient material that is helping to solve some of our greatest environmental challenges. However, we can’t realize its full benefits if we don’t work toward better end-of-life solutions,” said Russell. ACC and North American resin producers established a goal that 100% of plastic packaging will be reused, recycled or recovered by 2040. Meeting this goal and eliminating plastic waste in our ocean will further improve the environmental performance of plastic packaging. We all want a world without plastic pollution, but we wouldn’t want a world without plastic.”
The 2014 study
The 2014 study was an elaborate exercise using Life Cycle Analysis (LCA) methodology and focused on plastics packaging used in the USA and Canada. The materials studied were all the major thermoplastic resins used, as follows:
– Low-Density Polyethylene (LDPE)
– High-Density Polyethylene (HDPE)
– Polypropylene (PP)
– Polyvinyl Chloride (PVC)
– Polystyrene (PS)
– Expanded Polystyrene (EPS)
– Polyethylene Terephthalate (PET)
Other resins, including specialty copolymers, biopolymers and others were not included.
Alternative materials that substitute plastic packaging included: steel – aluminum, glass, paper-based packaging including corrugated board, packaging paper, cardboard (both coated and uncoated), molded fiber, paper-based composites and laminates, fiber-based textiles, and wood. Substitutes for plastic packaging varied depending on the market sector and packaging application. Cork and rubber were included as substitutes only in the caps and closures category.
The LCA focused on plastic packaging applications and the plastic materials which are substitutable by alternative materials. The packaging sector was divided into the following 6 major packaging segments that accounted for the bulk of packaging market by weight of materials used –
– Other rigid packaging (includes the subcategories non-bulk rigid packaging, rigid protective packaging, and rigid bulk packaging)
– Other flexible packaging (includes the subcategories converted flexible packaging, flexible protective packaging, and flexible bulk packaging)
– Beverage packaging
– Carrier bags
– Shrink and stretch film
– Caps and closures
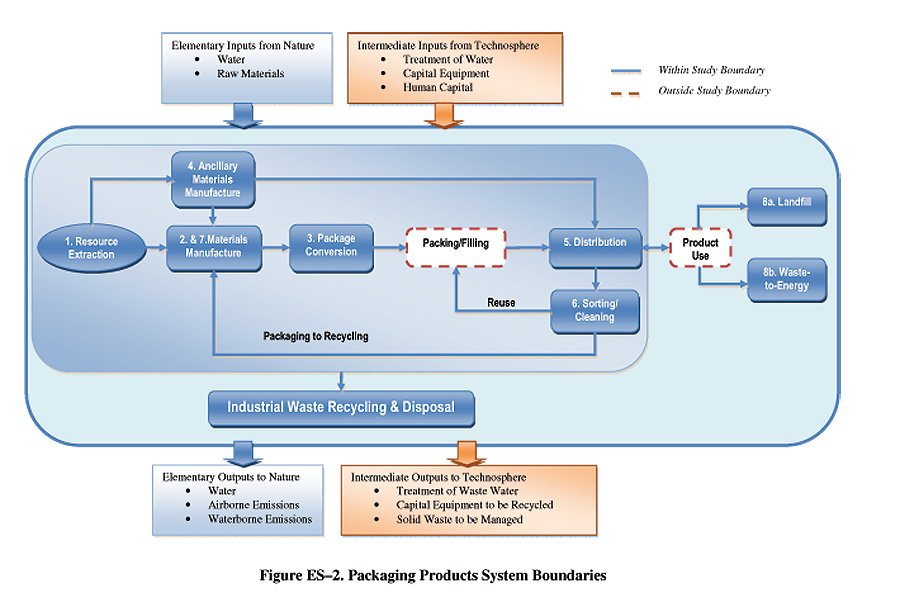
The following life cycle stages were included for each packaging material application:
1. Raw material production of the packaging materials, which consists of all steps from resource extraction through raw material production, including all transportation.
2. Fabrication of the packaging from their raw materials and the subsequent transportation of empty packaging from the fabrication site to the commodity filling site. (For your fabrication needs, visit a site like https://cir.net/).
3. Distribution transport of commodity and packaging from the commodity filling site to a the use site (focusing on differences in impacts due to packaging itself).
4. Post-consumer disposal of packaging in a landfill or waste-to-energy incineration, and/or
5. Recycling of packaging, including transport from the use site to recycling facilities, where applicable.
The flow diagram of boundaries is given in Fig.1’
Approximately a third of plastics production goes into plastics packaging (this was the 2014 scenario; the figure now is about 40%).
Findings of the 2014 study

Expended Energy is defined as Cumulative Energy Demand less the energy embedded in the materials and is available for recycling etc. (this is high for plastics).
The amount of materials used by plastics is 14.4 million MT and this goes up to 64 million MT for substitutes.
Conclusion
Despite the popular misconceptions that abound about Plastics Packaging, they are by far more sustainable than substitute materials and consume much less scarce material resources, energy and water.
1Eutrophication (from Greek eutrophos, ‘well-nourished’), or hypertrophication, is when a body of water becomes overly enriched with minerals and nutrients that induce excessive growth of plants and algae. This process may result in oxygen depletion of the water body. Eutrophication is characterized by excessive plant and algal growth due to the increased availability of one or more limiting growth factors needed for photosynthesis (Schindler 2006), such as sunlight, carbon dioxide, and nutrient fertilizers.